 In my last blog “Practicing what you preach!? Social performance of 5 social investors” last week, I told you about social performance of 5 microfinance investors. I though we could broaden the subject a little by looking at impact investors.
More and more investors and fund managers do not only want to receive a return on their investment, but they also want to “do good”, or “have an impact.” In October 2007, the Global Impact Investing Network (GIIN) was launched when the Rockefeller Foundation gathered a small group of investors to discuss the needs of the emergent impact investing industry. The GIIN is dedicated to increasing the scale and effectiveness of impact investing and addresses systemic barriers to effective impact investing by building critical infrastructure and developing activities, education, and research that attract more investment capital to poverty alleviation and environmental solutions.
Individual investors and service providers lack the capacity and mandate to solve infrastructure and market-level challenges alone. The GIIN’s programmatic agenda is rooted in the challenges faced by investors, and it serves as a forum for identifying and addressing the systemic barriers that hinder or impede the impact investing market.
The GIIN recently launched research on 310 impact investing funds from August 2014. and I thought I would tell you a little about the key highlights.
Definition of impact investing. Impact investments are investments made into companies, organizations, and funds with the intention to generate social and environmental impact alongside a financial return. Impact investments can be made in both emerging and developed markets, and target a range of returns from below market to market rate, depending upon the circumstances. The growing impact investment market provides capital to support solutions to the world’s most pressing challenges in sectors such as sustainable agriculture, affordable housing, affordable and accessible healthcare, clean technology, and financial services. There are a few characteristics with regards to impact investing:
- Intentionality – The intent of the investor to generate social and/or environmental impact through investments is an essential component of impact investing.
- Investment with return expectations – Impact investments are expected to generate a financial return on capital and, at a minimum, a return of capital.
- Range of return expectations and asset classes – Impact investments generate returns that range from below market (sometimes called concessionary) to risk-adjusted market rate.
- Impact measurement – A hallmark of impact investing is the commitment of the investor to measure and report the social and environmental performance and progress of underlying investments. Impact measurement helps ensure transparency and accountability, and is essential to informing the practice of impact investing and building the field.
The landscape is broad in terms of target geography, asset class, and impact theme. Private equity and venture capital (PE/VC) funds represent approximately half of the funds profiled on ImpactBase. About 20% of funds are fixed income, while 20% also invest using multiple instruments. While PE/ VC funds are quite dispersed in terms of geographic focus, fixed income and real asset funds have an especially strong focus on North America. The majority of fixed income funds have a social focus (76%), while PE/ VC funds are more evenly distributed between being either only socially focused or having a triple bottom line strategy (i.e. funds that have both social and environmental impact objectives).
Over 25% of funds on ImpactBase invest only in North America (82). Forty-two funds invest only in Africa, 37 target only Asia, while 52 invest across multiple emerging market continents. There are also 42 funds that invest across a range of both emerging and developed markets
Funds are highly diverse in size. Two-hundred and forty-one funds reported on committed capital (USD) and they are designated as follows:
-
SMALL: Committed capital less than or equal to USD 20 m
- MEDIUM: Committed capital between USD 20 m and USD 50 m
-
LARGE: Committed capital greater than USD 50 m
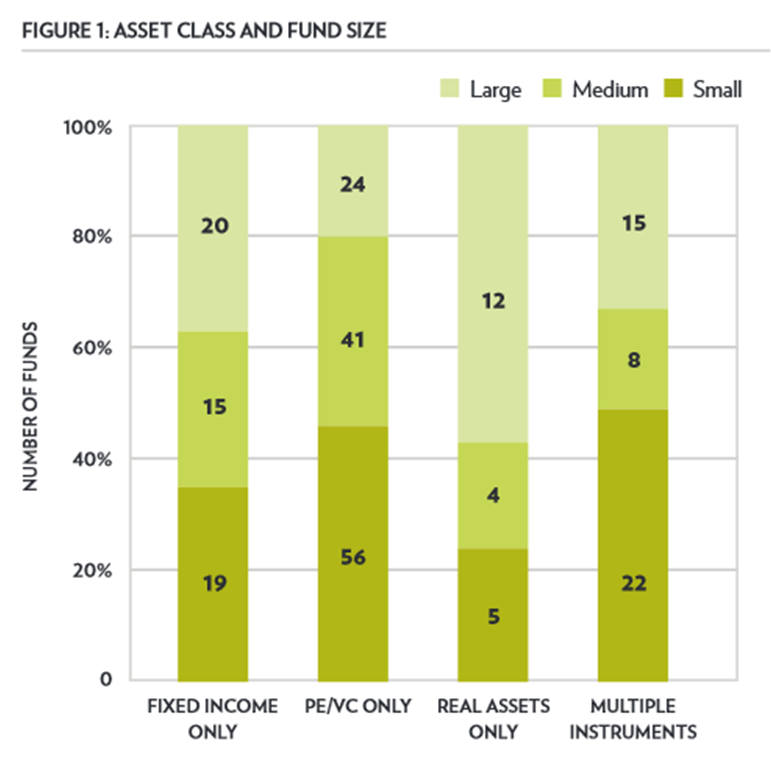
Asset class x fund size
In general, real asset funds are more likely to be large in size, while emerging market funds tend to be smaller. Interestingly, there are more than twice as many ‘small’ PE/ VC funds than there are ‘large’ ones.
Over 40% of funds in ImpactBase report 3+ years of track record. Most funds listed on ImpactBase have been incepted in recent years. Nearly 70% were launched after 2009. Meanwhile, only 13% of funds were incepted prior to 2006. In particular, it is PE/ VC funds that have driven recent growth. Of funds that were incepted prior to and including 2005, nearly 50% were fixed income, while about 25% were PE/ VC. However, of funds incepted post-2005, only 16% have been fixed income, while over 50% have been PE/ VC.
Fixed income funds tend to have the most experienced fund managers, with over 69% of funds reporting 3+ years of track record. On the other hand, 60% of real asset funds have no established track record.
Impact themes are highly diverse. Fund managers select from a range of impact themes across six broad categories (Environmental Markets and Sustainable Real assets, Green Technology/GreenTech, Sustainable consumer products, Access to basic services, Access to finance, Employment generation, others). Fifty-five percent of funds include ‘access to finance’ as an impact theme, 44% include ‘access to basic services’ and 38% ‘employment generation.
Many of the fund managers on ImpactBase report on average investment sizes. As might be expected, funds focused on making environmental investments have much larger average deal sizes (5×) than do those with a social focus. By asset class, those making real asset investments have significantly larger average deal sizes than others. Finally, those investing in developed markets have average deal sizes over 2× larger than those investing in emerging markets.
All funds also report data on the number of investments and exits they have made to date. The term ‘exits’ should be interpreted in context: In the case of fixed income, an exit could be the repayment of a loan which, for a revolving loan fund for instance, could lead to a high number of reported ‘exits.’ Fifty-five percent of reported fixed income deals in ImpactBase have been exited. This compares with 14% for PE/ VC and just 2% for real assets.
Fairly straight-forward fees. Fixed income funds have the lowest average management fees, while PE/ VC and real asset funds have the highest average carried interest. Compared to funds focused on developed markets, those focused on emerging markets tend to have higher management fees, carried interest and hurdle rates. It is also evident that average management fees decrease with fund size, while carried interest and hurdle rates increase with fund size.
Fund managers are actively looking to raise capital. The average fixed income fund has achieved 65% of target assets under management (AUM) in committed capital, while the average PE/VC and real asset funds have greater funding gaps. When examining the breakdown by geographic focus, committed capital for North America focused funds is 65% of target AUM, while Africa- and Asia-only funds average 26% and 33% respectively.
Significant market-rate investment opportunities in the industry. Whereas nearly one-third of socially focused funds target below-market returns, environmentally focused funds overwhelmingly target market rate returns. By asset class, fixed income funds are the most likely (about 50%) to pursue below-market rates. Real asset funds are all market rate, while about 80% of PE/ VC funds also target market rate returns. While there are noticeable differences across asset class and impact theme, return philosophy does not vary by target geography.
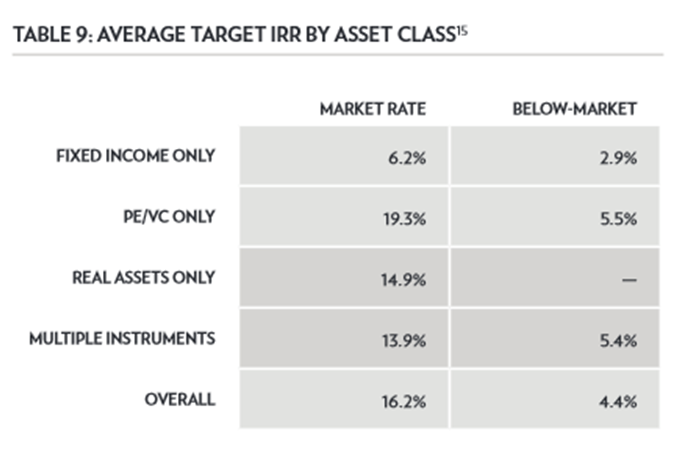 Target return categories can mean different things depending on target audience. For instance, fixed income funds seeking ‘below-market’ returns target an average IRR of 2.9%, while PE/ VC funds seeking ‘below-market’ returns target 5.5% on average. Meanwhile,PE/ VC funds seeking ‘market rate’ returns target 19.3% onaverage, while ‘market rate’ fixed income funds target 6.2%.
Where do impact investing funds fundraise? Seventy-six percent of market funds target family offices/high net worth individuals (HNWIs) when fundraising, 71% appeal to foundations. Only 17% target retail investors . Interestingly the biggest bucket, 79%, is “other institutional investors”, i.e., insurance companies and commercial banks. Looking at below-market funds, 86% appeal to foundations with other institutional investors and family offices /HNWI also prominent. Whereas 50% of market rate funds target pension funds, only 21% of below-market funds do.
Some interesting differences in fundraising targets based on the geographic focus of funds.While 67% of emerging market-focused funds target Development Finance Institutions (DFIs) for funding, only 25% of developed market-focused funds do so. At the same time, 86% and 54% of developed market-focused funds appeal to foundations and pension funds respectively, while only 69% and 39% of emerging market-focused funds do so.
The above blog draws heavily from the GIIN publication “ImpactBase Snapshot – An Analysis of 300 Impact Investing Funds. ”
Another, slightly older publication which is an interesting read is “Spotlight on the Market – The Impact Investor Survey” by the GIIN and JP Morgan.